Billing & finance · Financial reporting
Numbers you can follow all the way back to the receipt.
Operational reports read your documents. Official statements read the posted ledger. VROOM labels which is which, and every figure opens the transactions behind it.
What it does for you
What changes for your team
Operational vs official, clearly labelled
Reports marked Operational read documents directly; official statements read the ledger. They can differ for real reasons, and VROOM tells you which you are looking at.
Balances and flows never confused
Cash, receivables and payables are “as of” a date. Revenue and expenses are for a period. A closing balance is never labelled as a period total.
Exports that look like your company
Every finance report exports to Excel and PDF. PDFs are A4 portrait with your header, footer and Page X of Y.
Everything is logged
Every export is recorded in the activity log, and full-history exports ask for confirmation first.
How it works
Answering “why is this number what it is?”
Choose the period
This month, quarter, year, last year, custom or all history. VAT screens use FTA tax periods only.
Customise the display
Rows shown, number format and section titles. Customise never changes a figure.
Drill down
Click an account to open its ledger, then a ledger row to open the source document.
Export
Download Excel or an A4 PDF to share with your accountant, investors or management.
In detail
What’s included
Operational reports
- Receivables and security deposits
- VAT return and VAT report
- Broker report and broker statement
- Investor report
- Vehicle profitability
- Charges report and revenue report
- Operational revenue, P&L, cash flow, payments and expenses
Dashboards and charts
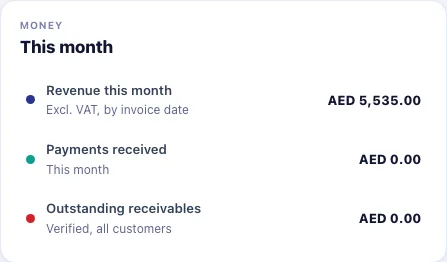
- Main dashboard: fleet right now, today’s list, money this month
- Finance dashboard: ledger balances and period income and expenses
- Rentals chart: 7 / 30 days, month, quarter, year, 12 months
- Revenue chart: 3 / 6 / 12 / 24 months and year
- “No data for this period” instead of misleading empty charts
Questions
Financial Reporting: common questions
Something else? Ask our team or read the Help Center.
Why might operational profit differ from the official P&L?
Historical invoices that were never posted, different dates and possible double-counting of fines all cause differences. The operational P&L warns when fines may be counted twice.
Can investors see reports?
Investors get a separate portal that shows only their own statements. They never see the main CRM.
Connected to
Works hand in hand with
Next step
See your own rental workflow in VROOM.
Book a live demo and we will walk through a rental from booking to the financial statements, using demonstration data.